Jev launched last week, and people are already sorting inboxes and even playing Doom with it. It uses a model to make structured decisions inside a larger algorithm, and I had seen that pattern before. When I built the first version of Figma-to-code at Builder.io, I used a much narrower classifier. Our visual editor let marketers and designers place things where they looked right without learning the HTML mental model, but the result still needed a responsive layout.
 me, on X Jev Is this my old model?
 Figma and the web both represent documents as trees, but a Figma tree can be a much bigger mess. Nodes sit wherever the composition needs them, multiple frames overlap to create effects that could be a single CSS line, old iterations still exist hidden under some opaque white rectangle… I have seen it all.
Frontend developers take that composition and decompose it into rows, columns, and constraints that can respond to different screen sizes. Copying every node into an absolutely positioned element looks right at one screen size and breaks at every other.

Figure 1. A Figma design. Its groups do not necessarily match a responsive web layout.
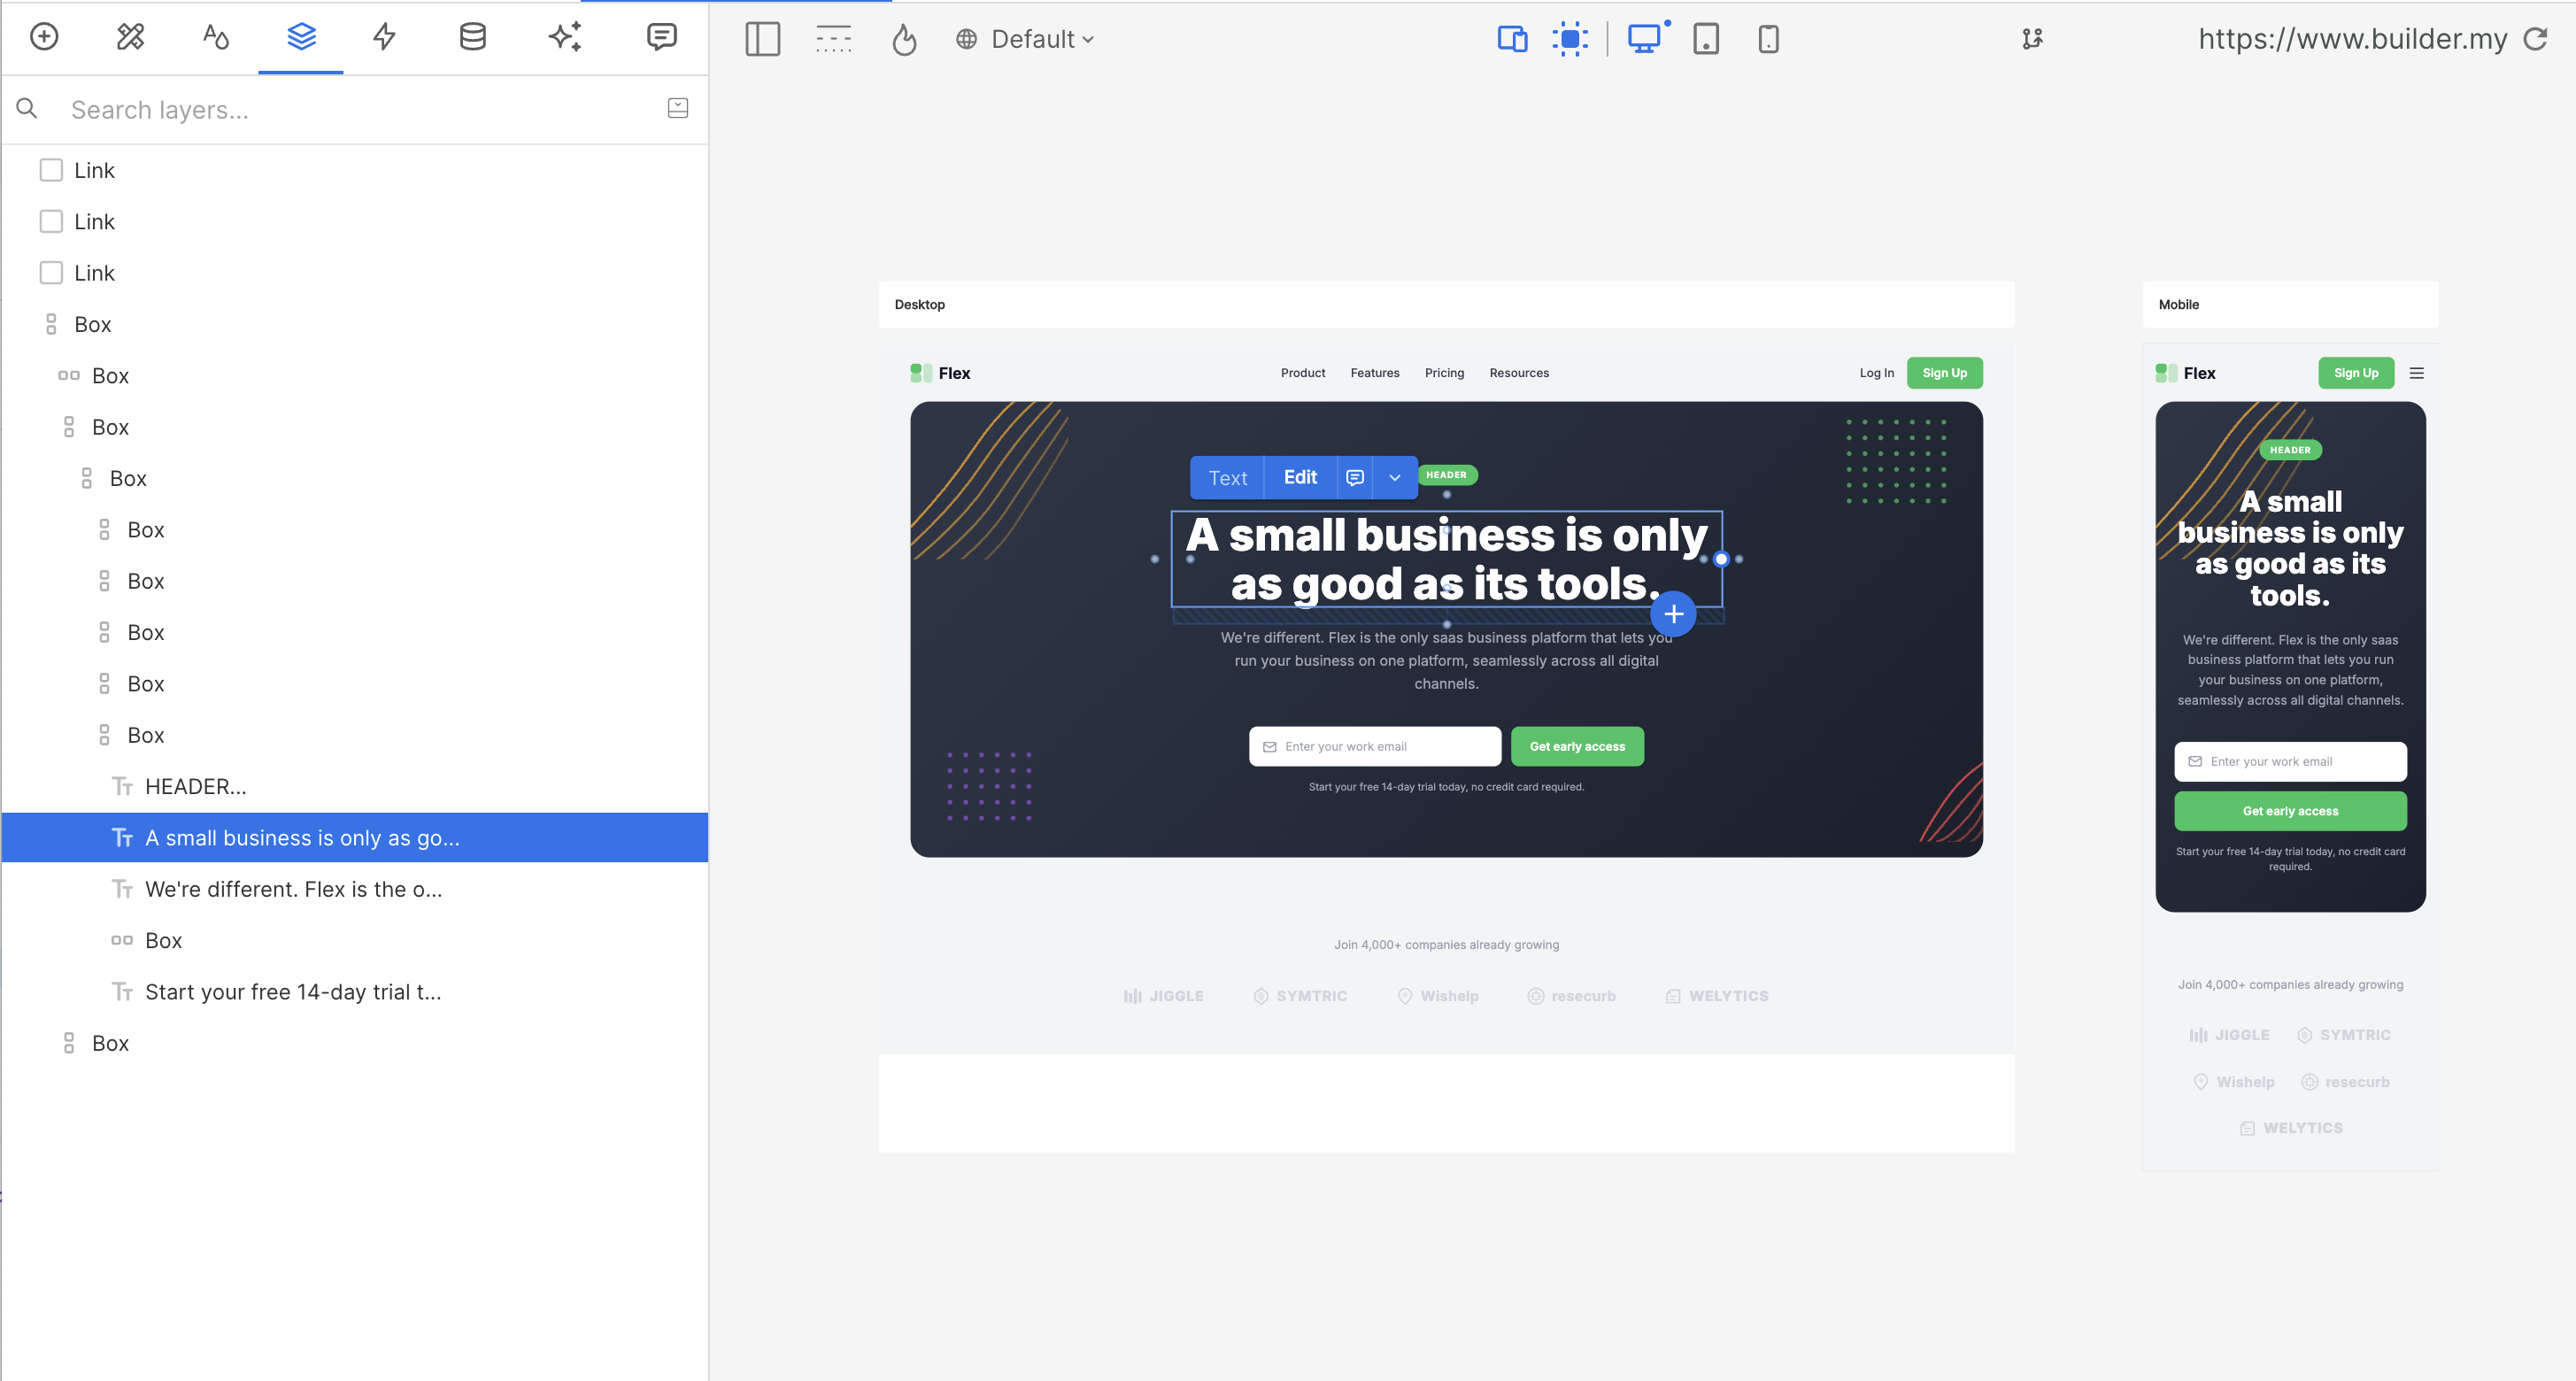
Figure 2. Responsive output at desktop and mobile sizes.
Data dominates
As a big fan of Rob Pike, I started thinking in terms of data structures. A Figma design could be a single node or a 30 MB monstrosity, while the decision-tree models I wanted to try expected a fixed number of inputs.
Models can work on variable-size inputs, including graphs, but a good-looking Figma design could be a flat frame with 400 sibling nodes. Nothing in that frame says which nodes belong together, and converting it one to one would make a terrible website. Figuring out that grouping was the whole problem!
The breakthrough
We had the model compare two possible merges. We could use those comparisons to choose which nodes to group, then repeat with the new groups, instead of asking a model to turn the whole Figma tree into responsive HTML.
Imagine rendering a responsive website, then throwing away its hierarchy. Keep each visible element’s bounding box, its position and dimensions, in a flat array:
nodes = [node1, node2, ..., nodeN]A candidate merge proposes joining two nodes or groups under a new parent. One candidate might join a heading with its paragraph, another might join two neighboring cards. The model compares them and predicts whether both merges are valid, neither is valid, or only one is valid.
compare(candidateA, candidateB)
  → probabilities for [both valid, neither valid, only A valid, only B valid]
Each candidate became 21 numbers describing its geometry and structure: group dimensions, their enclosing box, alignment, distances, child counts, and information about alternative merges. Two candidates gave us 42 input features, regardless of the size of the design. The model did not read the text or look at colors.
After experimenting with different models, we settled on gradient-boosted decision trees, using XGBoost. A decision tree follows branches based on its inputs to make a prediction, and boosting combines multiple trees. Speed mattered because rebuilding a hierarchy meant repeatedly comparing candidates in a tournament, applying compatible winners, then building the next round.
Training data
The internet is our dataset! Take a responsive website and the original HTML gives us a tree to learn from. Render it with Chromium, compute the relevant elements’ bounding boxes with getBoundingClientRect(), and keep their parent-child relationships as the known answer.
After combining redundant nested rows and columns, we labeled a candidate merge valid when its two groups belonged to the same expected parent. Two independent branches could both have a valid merge, so we didn’t need to prescribe a single order for reconstructing the page. Comparing two candidates gave us one of the four labels:
...candidateA.features, ...candidateB.features, matchupLabel
         21 values              21 values       one of 4 classes
A single layout could supply many rows for our training CSV as we reconstructed its hierarchy and encountered new candidates.
From known parents to a training row
Keep the answer before flattening
The dashed outlines show the known parents: h1, p and btn belong to “copy”; card1, card2 and card3 belong to “cards”.
Check one proposed merge
Try joining btn and card1. Their box passes the geometry check, but they have different parents, so we label this merge invalid.
Turn pairs into training examples
Compare two proposed merges: A joins h1 + p, B joins btn + card1. A has a shared parent and B does not, so this training row gets “only A valid”.
Reverse the inputs
Now put btn + card1 first and h1 + p second. The merges stay the same, but the label becomes “only B valid”. That gives us a second training row.
Both merges can be valid
Compare h1 + p with card1 + card2. Each merge has a shared parent, so the label is “both valid”. We repeat this check for every ordered pair of different candidates.
We manually selected good websites, trained the model, and tried it against other websites and designs. The designs it could not reproduce guided what we added to the next training set. Data collection and training were heavily coupled and order-dependent, but we ended up with a small dataset covering a variety of designs and website structures.
We could also inspect the trees for suspicious rules, but reasonable-looking conditions could still fit only the training examples. We still needed to test on designs outside the training data.
A tournament between merges
With 1,000 nodes, there are 499,500 possible pairs, before we even compare possible merges with each other. Our first algorithm filters out pairs that geometrically cannot occur.
For separate boxes, a merge’s bounding box must not intersect a third node. A heading and its paragraph might be a candidate, while the heading and a card at the bottom of the page would enclose unrelated content.
We handled containment before this search, recursed into children, and kept existing auto-layout structure. The demos use separate boxes to leave those cases out.
We then compare every candidate against every other candidate. With candidates, that gives us matchups. The model’s most likely class determines how we update their scores:
- Both valid: each candidate gets half the predicted probability.
- Neither valid: each loses half that probability.
- Only one valid: that candidate gets the full probability, the other gets nothing.
If “both valid” wins with probability 0.8, each candidate gains 0.4. These contributions accumulate across matchups, so tournament scores can exceed 1 or fall below 0.
Two merges enter the comparison
Start with the legal merges
Each bar is a possible merge. Five candidates need ten comparisons to complete this tournament.
Ask a small question
The model returns four probabilities. Here “both valid” wins, so each candidate gets half that probability.
Let every candidate play
The remaining matchups update the scores. A “neither valid” prediction would subtract from both candidates.
Take the highest score
This round selects the heading and paragraph. Winners must also have non-overlapping rectangles, so we can apply their merges in the same round.
We sort by score and select the highest-scoring merges whose rectangles do not overlap. Two equally good candidates may share a node, in which case one has to wait.
The September 2023 implementation used the maximum score as its cutoff, or 95% of that maximum for more than 20 candidates. Later, k-means split the scores into two clusters, and we used how tightly they clustered to help adjust the cutoff. These demos use the earlier rule with recorded predictions from the currently checked-in model; scoring and merging run in the browser.
Building the tree
After each tournament, the merged groups become nodes for the next round. A heading and paragraph become a column, join a button, then join an image in a row. The model keeps answering the same question about larger groups, and we keep their children to build the tree.
Watch the hierarchy come back
Begin with the boxes
We start with eight rectangles and their positions, with the hierarchy removed.
Reject impossible groups first
Joining the heading and button would enclose the paragraph, so geometry rejects it. Joining the heading and paragraph passes.
Run the tournament, then repeat
After each round, we recompute the candidates. Two independent merges can happen together.
There is a tree again!
The tree has one root after seven merges. Redundant nested rows combine into one row, and nested columns into one column.
The main loop looks roughly like this:
while more than one group remains:
    candidates = geometrically possible merges
    if there is only one candidate:
        merge it
    else:
        compare candidates in a tournament
        choose high-scoring, non-overlapping merges
        apply the chosen merges
    stop if no progress is possible
When geometry blocked progress, one fallback temporarily removed a group, solved the rest, then joined it back. The algorithm could still fail, or finish with a hierarchy a developer would not have chosen.
I used AIR to inspect each merge and its scores. Here is the original tool running again locally:
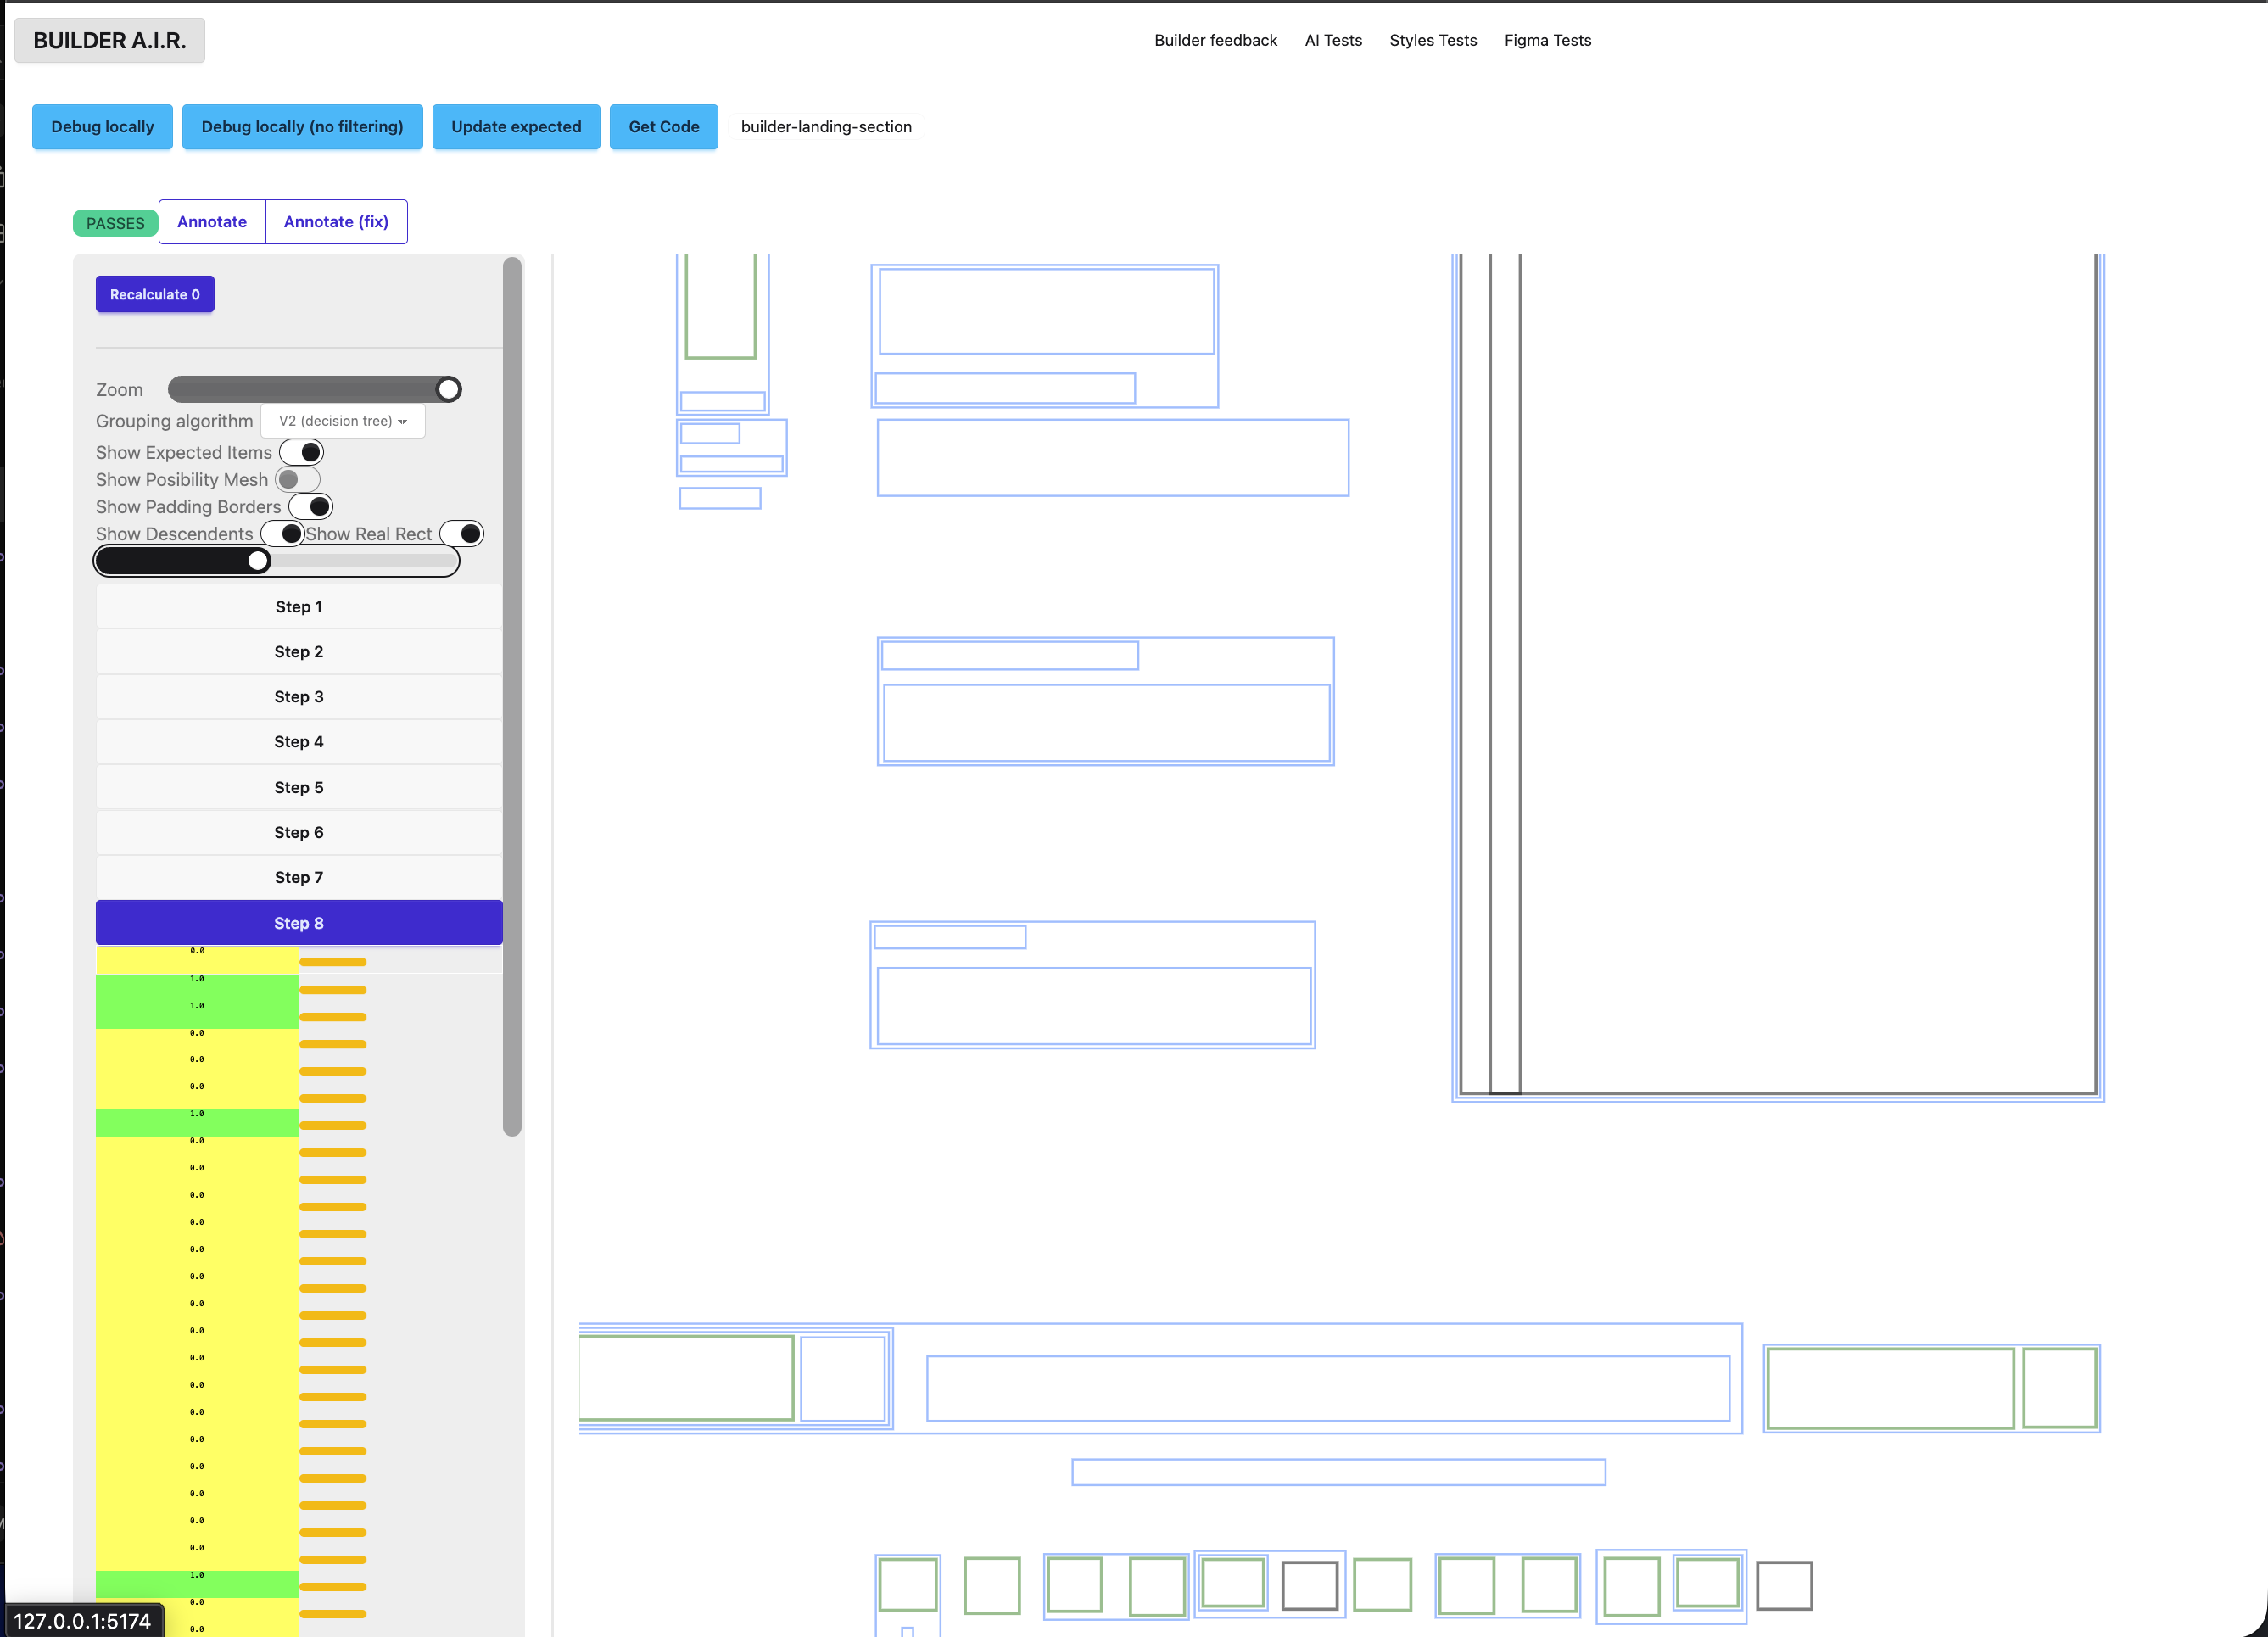
Figure 3. The original internal tool. On the left, reconstruction steps and scores; on the right, the groups at the selected step. Open the image to inspect it at full size.
From hierarchy to layout
The model only recovered the hierarchy. We got colors, typography, borders, and other inline styles directly from the Figma nodes. Heuristics then decided alignment, margins, gaps, padding, and sizing.
The recovered groups let us make layout decisions locally: spacing between cards in a row, or alignment within a column of text.
Real Figma files
Hierarchy extraction worked very well, but getting production-ready results was much harder when the team had not been careful with the Figma designs. For some customers it worked so well, and for others it was a disaster.
Even with a plausible hierarchy, hidden iterations and overlapping shapes could still make the output unusable.
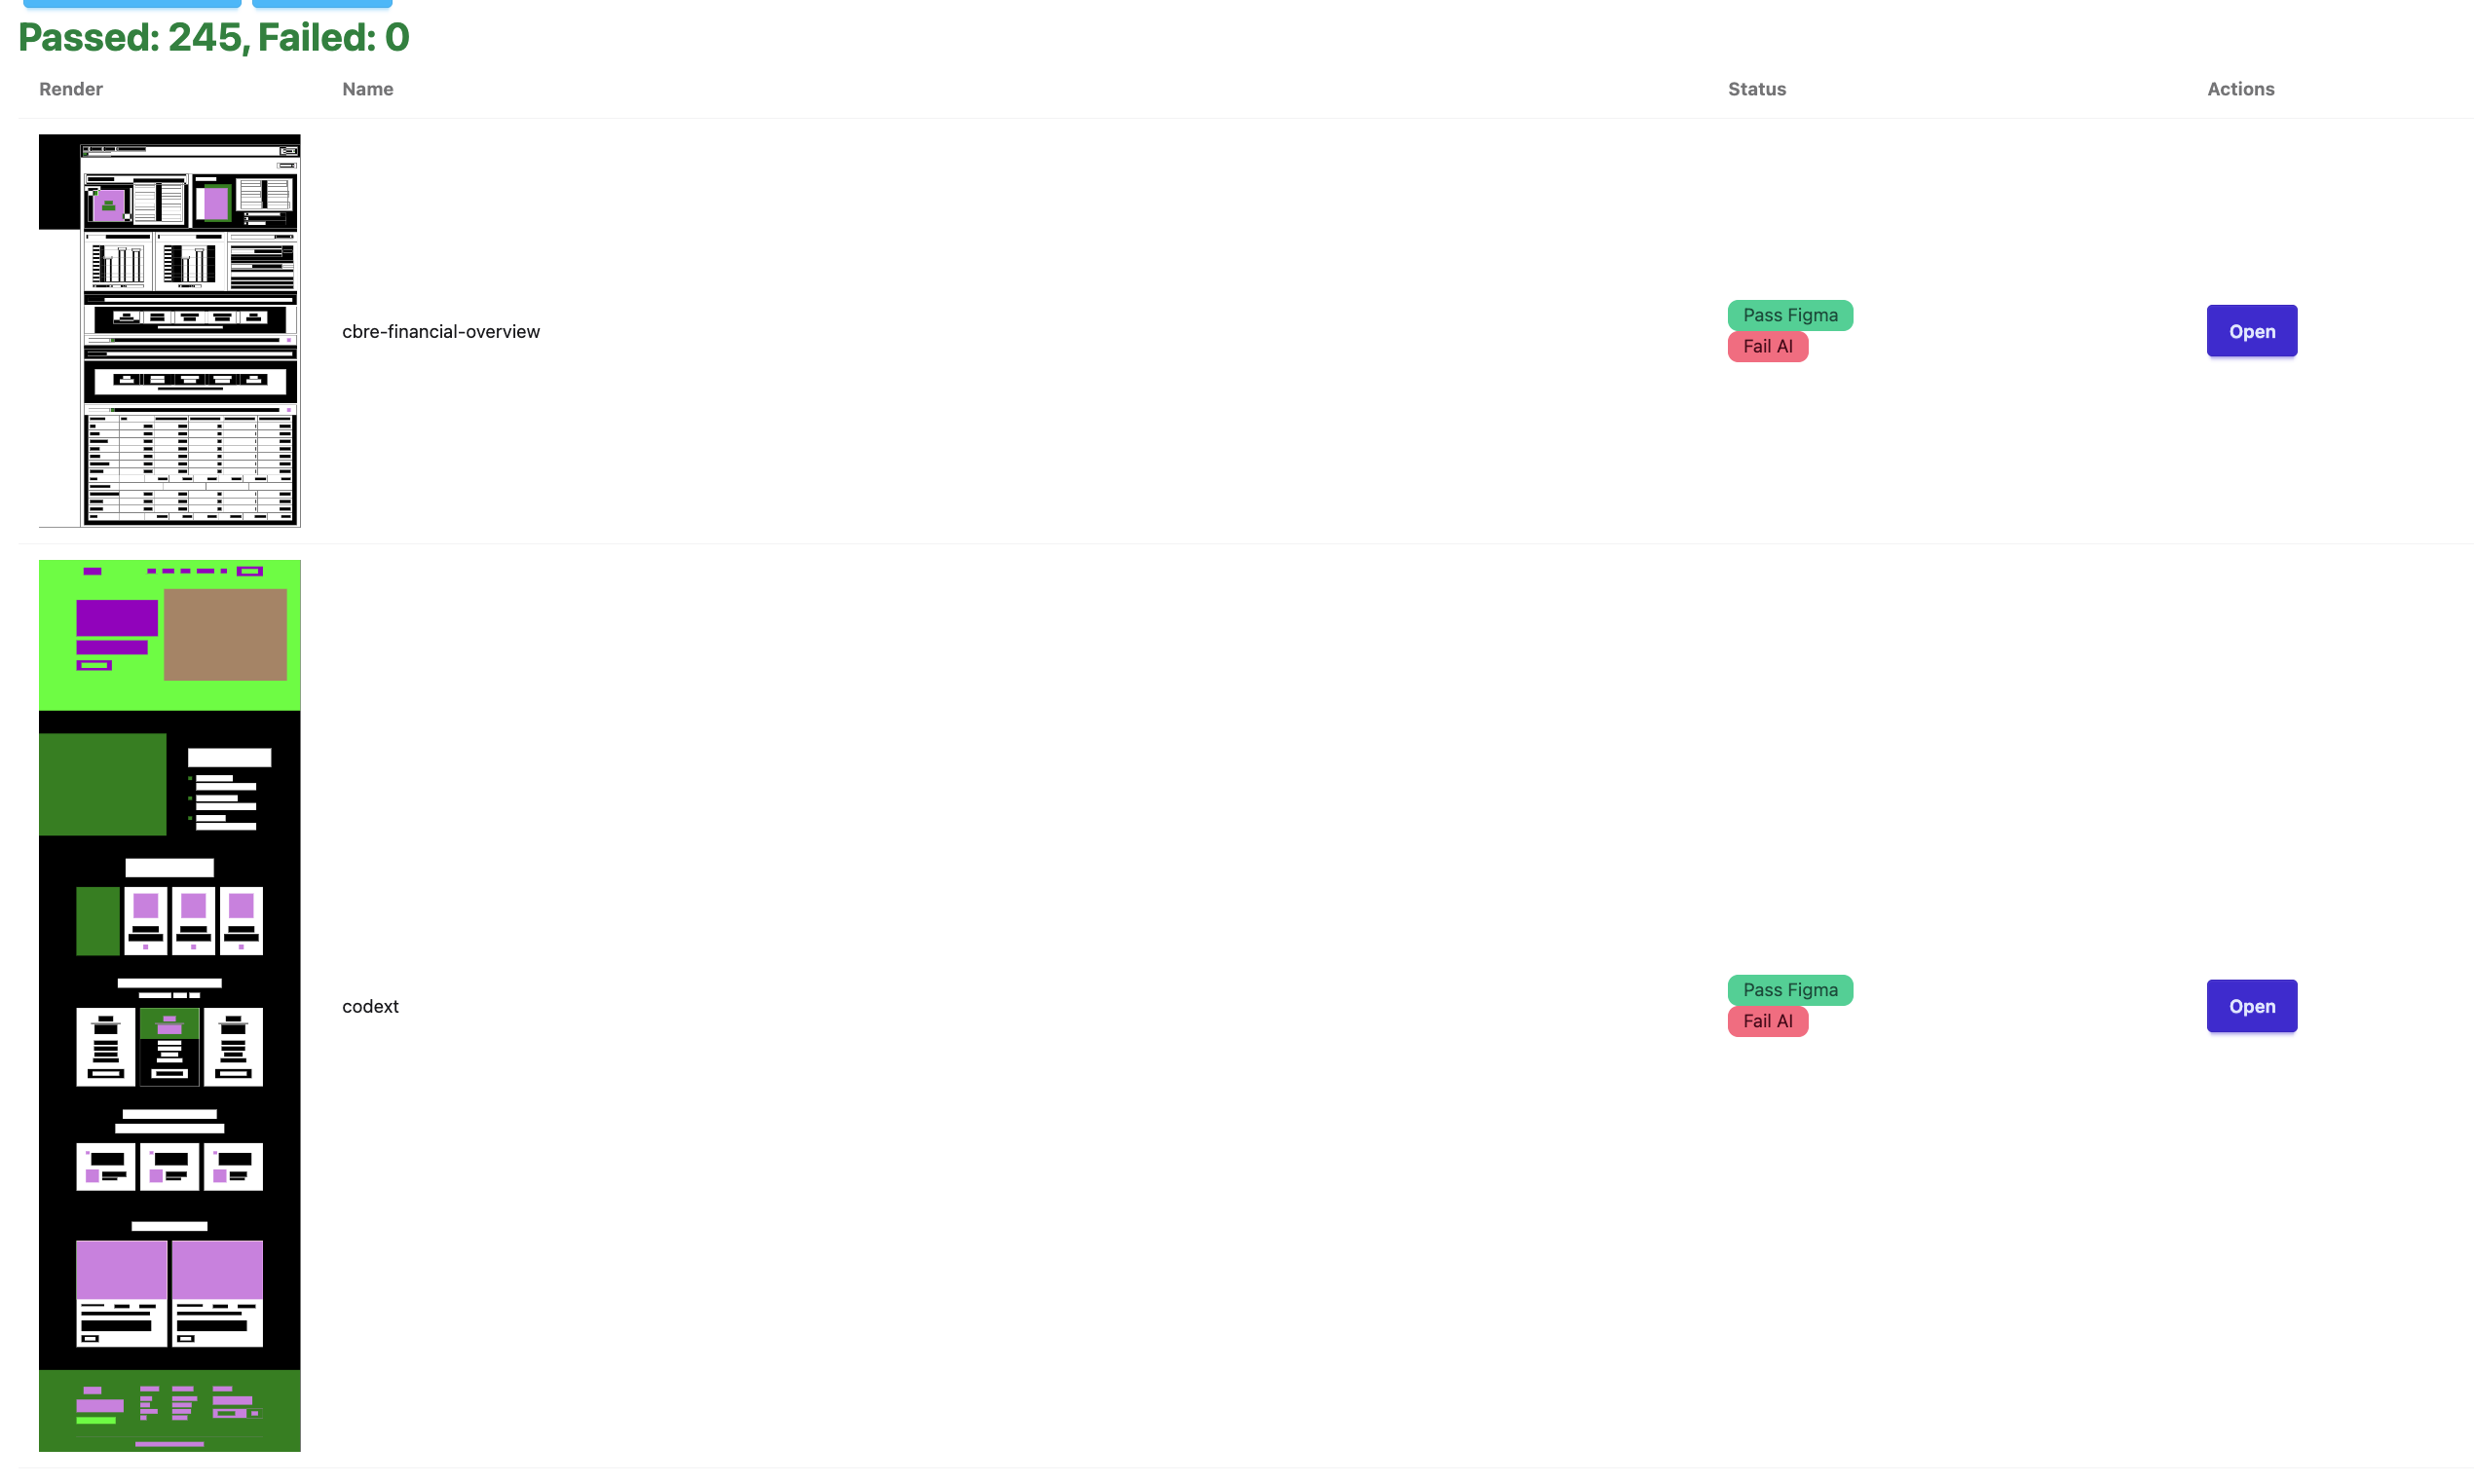
Figure 4. Separate checks in AIR. The “245 passed” heading counts Figma preprocessing checks. These visible fixtures pass that check but fail the expected hierarchy comparison, labeled “AI”. This is a local test run, not a model accuracy benchmark.
What I still like about this project is that hundreds of design nodes became comparisons with just 42 inputs.